Market Oracle - ALERT: Gold-to-Silver Ratio Spikes to Highest Level in 27 Years!

Article by Jason Hamlin on Market Oracle
The gold-silver ratio has been one of the most reliable technical ‘buy’ indictors for silver, whenever the ratio climbs above 80.
The gold-to-silver ratio has now spiked above 85, which is the highest level of this entire 18-year bull market! In fact, you have to go back 27 years to 1991 for the ratio to be higher than it is today. Amazingly, the ratio is currently higher than it was at the depths of the 2008-09 financial crisis.

The ratio represents the number of silver ounces it takes to buy a single ounce of gold. It might sound simple, but this ratio is more powerful than it may seem at first blush.
Historic Ratios for Comparison
Over the past 20 years, the ratio has averaged right around 60:1. Thus, the current ratio of 85 is very high historically and nearly 60% above the 20-year average. The ratio is signaling that silver is extremely undervalued relative to gold at this point in time.
Take a look at the historical chart for the gold-to-silver ratio for perspective on just how high it is today at today at 85…
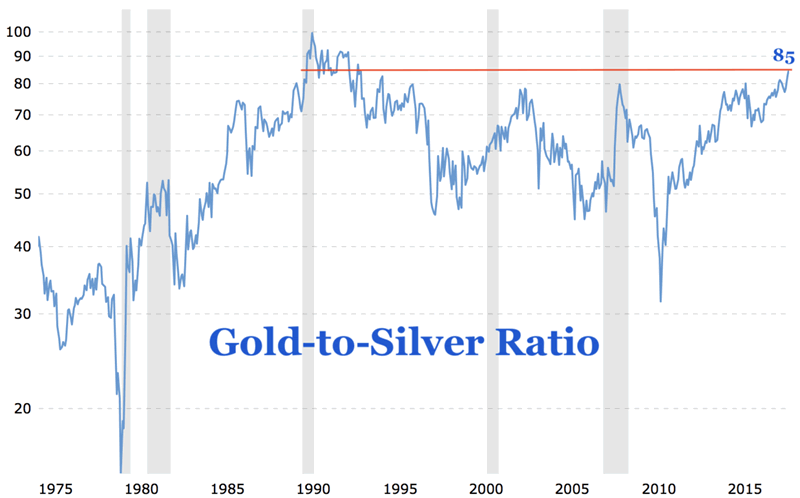
In the past, the gold-to-silver ratio spiked higher during times of economic instability or Recession (see grey shaded areas). This makes sense as gold is generally viewed more strongly as a safe-haven asset than silver and institutional investors move funds primarily to gold (or dollars) for safety. Furthermore, nearly 50% of silver’s demand is industrial, so economic contraction would impact the price more severely.
The silver price falling more rapidly than the gold price or climbing more slowly than the gold price increases the ratio. Put simply, it takes an increasing number of silver ounces to buy a single ounce of gold during these periods.
Yet, the current gold-to-silver spike is happening absent a major crisis, as economic growth picks up and major stock indices hit new all-time highs. It looks a little reminiscent of the period from 1982 to 1987, leading up to the Black Monday stock market crash. The ratio also rose from 1988 to 1990, again leading into a major stock market correction.
Is the Current Spike in the Gold/Silver Ratio Forecasting Another Stock Market Crash?
The ratio typically spikes to extreme levels during the depths of an economic crisis or leading up to a significant correction in the equity markets. The stock market is currently very robust and enjoying an unprecedented 10-year bull market with gains in excess of 300% for the S&P 500 or 400% for the NASDAQ. So the spike is not driven by a crisis that already exists, increasing the odds that we are quickly approaching a major correction in the markets.
Why else would investors be favoring gold so strongly over silver during a time of healthy economic growth?
To read this article on Market Oracle in its entirety, click here