What is the Gold to Silver Ratio?

In the simplest of terms, the gold-silver ratio is calculated by determining how many ounces of silver it takes to purchase one ounce of gold. For example, if the price of one ounce of gold is $1300 and silver is trading at $20 per ounce, then the ratio is 65:1 ($1300 divided by $20). Why is this ratio important to some investors?
Why Investors Monitor the Gold-Silver Ratio
Many precious metal enthusiasts keep an eye on the gold-silver ratio because when the number is extended above or below the average, it’s potentially an opportunity to purchase or sell, based on historical data with the assumption that prices will move back to their mean. So, a really high ratio would potentially indicate that silver is undervalued and a more attractive buy compared to its sister metal and therefore a good time to invest in silver. Conversely, when the number is well below its average, gold could be a better buy, so the argument goes.
When reviewing historical data, it’s important to understand the time frame under consideration. There are huge swings in the ratio depending on what century or timeframe you’re referencing. In the 1800’s, the ratio averaged around 16. You frequently see this numbers referenced in articles by gold bugs. At that time, the United States was on a bimetallist currency system that fixed the ratio as part of monetary policy. The discovery of the Comstock Lode and other important silver discoveries and bonanzas out west put immense pressure on the fixed ratio with silver becoming more and more abundant. The eventual abandonment of the gold standard allowed the prices of these two metals to float against each other, giving us potentially useful signals about valuation and relative supply and demand.
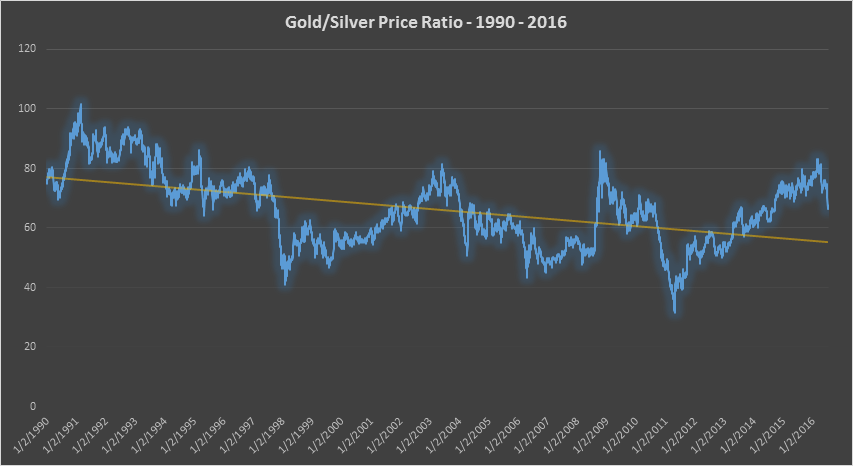
During the last 25 years or so, the number has averaged 66 and stayed within an approximate range of 40 – 100; noting that the ratio trend line is gradually going down.
Precious Metals Price Moves Can Be Attributed To Many Factors
There are additional considerations that contribute to the potential contraction or expansion of the gold-silver ratio: global jewelry demand trends, mining costs and supply, economic growth, geo-political unrest, easing or tightening of monetary policies, Central Bank purchasing, demand by individual investors for physical ownership of precious metals and new investment categories such as exchange traded funds (ETFs) that require fractional ownership of the metals by the institutions who create these vehicles.
The latter half of the twentieth century increased the demand for both metals, especially silver, due to augmented industrial output and technological discoveries. Silver is found in many newer technologies including the circuitry that runs cell phones, laptops, i-Pads and all things LED. There is also a growing demand for silver in the production of solar panels.
In conclusion, over the past century, the historical gold silver ratio has experienced quite a bit of volatility and hovers in the sixties at the time of publishing (Aug 2016). The recent ratio trend line has a downward trajectory implying silver is closing the gap due to some of the reasons previously stated. One certainty: the long term trend for the price of both gold and silver is up. With limited supply and growing demands will the gold-silver ratio ever go back to 16:1? Only time will tell.