Weekly Headlines
-
Could the US Inflate Its Way Out of $39 Trillion in Debt?
With the national debt now above $39 trillion, the U.S. government may be running out of workable solutions. One strategy used after World War II could quietly reduce the debt burden, but potentially at the expense of savers' purchasing power. See how "financial repression" works, the warning signs to watch, and why this policy shift could create a more supportive long-term environment for gold.

-
-
CPI Cools-But Could Inflation Pressures Return Next Month?
June inflation came in below expectations, but former Goldman Sachs analyst Nic Puckrin cautions that the report is backward-looking. With energy prices beginning to rise again amid renewed U.S.-Iran tensions, today's encouraging numbers may not tell the full story.

-
Gold Rebounds More Than 2% After CPI Data
Gold climbed 2% after June inflation came in below expectations, weakening the dollar and reducing expectations for an immediate Federal Reserve rate hike. See what is driving gold's rise and which economic and geopolitical signals markets are watching next.

-
India and China Trim U.S. Treasuries as Gold Reserves Rise
Two of the world's largest economies are reducing their exposure to U.S. government debt while building their gold reserves. India's Treasury holdings have fallen to a six-year low, while China has also made substantial cuts. See what this gradual shift could signal about confidence in dollar-based assets.

-
-
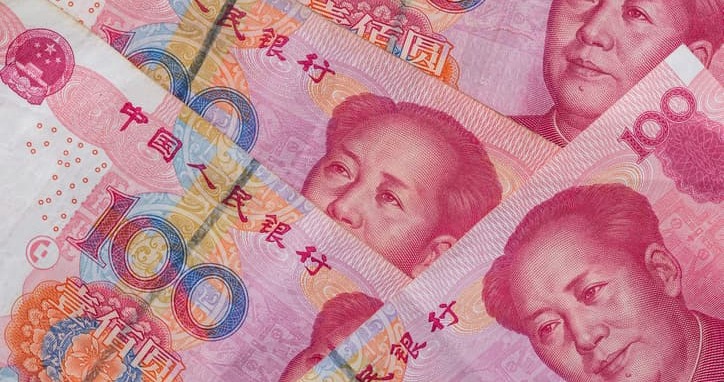
China's Long Game Against Dollar Dependence
China is taking new steps to expand the global use of its currency and reduce reliance on the U.S. dollar. While the renminbi may not replace the dollar anytime soon, Beijing's latest moves signal a long-term push to build financial alternatives that could reshape global trade, reserves, and America's influence in the world economy.
![]()
-
Could AI Spending and High Rates Shake the Stock Market?
Even with the U.S. economy showing signs of strength, Wall Street may be facing a more fragile setup. High valuations, rising real interest rates, and heavy AI spending are raising new questions about whether today's market momentum can continue.
![]()
-
Inflation Risks May Linger Despite Iran War Ending
A top European central banker warned that inflation could remain elevated even after the U.S.-Iran conflict eases. The concern: energy price shocks may still be working through the economy, keeping pressure on central banks, consumers, and markets.
![]()